

Authors
Vaibhav is a part of Newschecker’s English team, where he spots and debunks all kinds of misinformation, making the rounds on the internet. A Journalism graduate from St. Xavier's College, Mumbai, he holds an M.A degree in Philosophy and an M.Phil from Delhi University.
In light of the recent economic crisis in Sri Lanka, a graphic comparing the debt to GDP ratio of Sri Lanka and India is going viral on social media along with the claim that India will soon face an economic crisis similar to the ongoing crisis in Sri Lanka.
The post has been shared on Facebook by a page called ‘Dr.Manmohan Singh – Fan Club’ which has 6,90,868 followers on the platform. The post has garnered 1,000 shares and 166 comments along with the caption ‘Are we ONE year behind SriLanka???‘.
Newschecker found similar claims on Twitter with different captions.
Sri Lanka is currently going through a severe financial crisis. Protests are taking place across the country after it was reported that there is a shortage of essential commodities including medicine, fuel etc. According to a CNN report, the economic crisis faced by Sri Lanka was driven by a little bad luck and a lot of government mismanagement.
In early March this year, the International Monetary Fund (IMF) warned Sri Lanka of a major economic crisis.The Sri Lankan government continued to take loans from China, Japan, IMF and many other countries and global institutions to dispense its obligations towards public concerns.
Also read: Was Luthra Sharif Dargah In Chhattisgarh Targeted By Saffron Clad Men? No, Viral Claim Is Misleading
Fact Check/ Verification
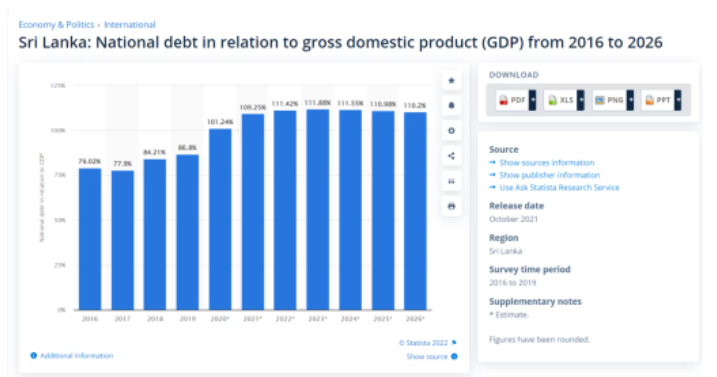
Upon conducting a keyword search using ‘sri lanka’s current debt to gdp ratio’ we found the data regarding Sri Lanka’s national debt in relation to GDP from 2016 to 2026 on a website called Statista. According to the report “this statistic shows the national debt of Sri Lanka from 2016 to 2019 in relation to the gross domestic product (GDP), with projections up until 2026.”
Upon further investigation, Newchecker found the total debt of India and Sri Lanka and what percentage of the Gross Domestic Product (GDP) it is on the official website of the International Monetary Fund (IMF).
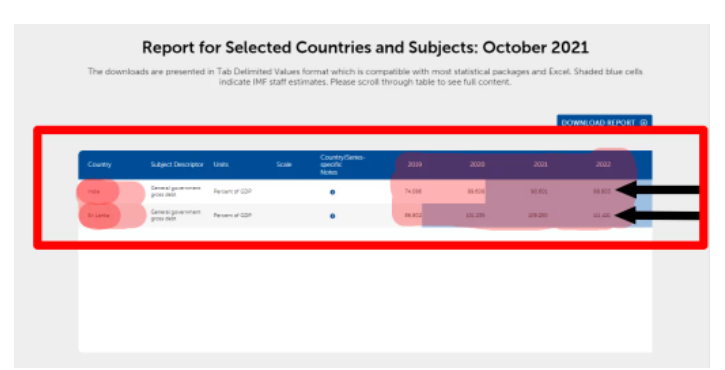
According to the data published by the IMF, Newschecker found that the total debt on India is equal to a large part of GDP, while the total debt on Sri Lanka is more than its total GDP.
| Country | Subject Descriptor | Units | Scale | Country/Series-specific Notes | 2019 | 2020 | 2021 | 2022 | 2023 | 2024 | 2025 | 2026 |
| India | General government gross debt | Percent of GDP | 74.086 | 89.608 | 90.601 | 88.803 | 88.135 | 87.294 | 86.335 | 85.194 | ||
| Sri Lanka | General government gross debt | Percent of GDP | 86.802 | 101.235 | 109.25 | 111.421 | 111.883 | 111.55 | 110.983 | 110.204 |
According to the information available on the official website of RBI, India’s total debt in the financial year 2020-21 is 73.95% of the country’s GDP of which only 2.62% of the total debt on India of the said financial year is external debt/liabilities. The remaining 71.33% share is domestic debt/liabilities, of which 26.63% is in the form of debt to the states and the remaining 48.24% is in the form of debt to the central government.
| TABLE 232 : SELECT DEBT INDICATORS OF THE CENTRAL AND STATE GOVERNMENTS | ||||||
| (As percentage to GDP) | ||||||
| Year (end-March) | Domestic liabilities of Centre | External liabilities of Centre | Total liabilities of the Centre (2+3) | Total liabilities of the States | Combined domestic liabilities of Centre & States | Combined total liabilities of Centre & States |
| 1 | 2 | 3 | 4 | 5 | 6 | 7 |
| 1982-83 | 36.20 | 10.28 | 46.48 | 18.80 | 43.01 | 53.29 |
| 1983-84 | 34.99 | 10.48 | 45.47 | 18.86 | 42.06 | 52.55 |
| 1984-85 | 37.72 | 10.38 | 48.10 | 19.77 | 45.57 | 55.95 |
| 1985-86 | 41.22 | 11.16 | 52.38 | 21.19 | 49.35 | 60.51 |
| 1986-87 | 45.15 | 11.29 | 56.44 | 21.57 | 53.55 | 64.85 |
| 1987-88 | 46.80 | 12.72 | 59.52 | 22.05 | 55.43 | 68.15 |
| 1988-89 | 46.70 | 12.38 | 59.08 | 21.46 | 55.32 | 67.70 |
| 1989-90 | 47.79 | 13.15 | 60.94 | 21.89 | 56.91 | 70.06 |
| 1990-91 | 48.28 | 11.31 | 59.59 | 21.86 | 57.54 | 68.85 |
| 1991-92 | 47.15 | 16.28 | 63.42 | 21.82 | 56.61 | 72.89 |
| 1992-93 | 46.43 | 15.62 | 62.05 | 21.74 | 56.39 | 72.01 |
| 1993-94 | 48.31 | 14.34 | 62.65 | 21.08 | 58.05 | 72.39 |
| 1994-95 | 46.64 | 13.63 | 60.27 | 20.70 | 56.41 | 70.04 |
| 1995-96 | 45.24 | 12.10 | 57.34 | 20.34 | 55.18 | 67.28 |
| 1996-97 | 43.79 | 10.54 | 54.32 | 20.14 | 53.83 | 64.37 |
| 1997-98 | 45.98 | 10.27 | 56.24 | 21.04 | 56.02 | 66.29 |
| 1998-99 | 46.28 | 9.87 | 56.14 | 22.16 | 57.24 | 67.11 |
| 1999-00 | 47.58 | 9.23 | 56.81 | 25.19 | 61.24 | 70.47 |
| 2000-01 | 50.64 | 8.73 | 59.36 | 27.29 | 64.94 | 73.67 |
| 2001-02 | 54.96 | 8.47 | 63.44 | 29.32 | 70.32 | 78.79 |
| 2002-03 | 59.12 | 7.73 | 66.85 | 31.01 | 75.13 | 82.86 |
| 2003-04 | 59.50 | 6.48 | 65.98 | 31.79 | 76.75 | 83.23 |
| 2004-05 | 59.64 | 5.90 | 65.53 | 31.28 | 76.24 | 82.13 |
| 2005-06 | 58.64 | 5.25 | 63.90 | 31.08 | 73.82 | 79.07 |
| 2006-07 | 56.72 | 4.68 | 61.40 | 28.91 | 69.98 | 74.66 |
| 2007-08 | 54.65 | 4.21 | 58.86 | 26.63 | 67.23 | 71.44 |
| 2008-09 | 53.93 | 4.69 | 58.62 | 26.11 | 67.52 | 72.21 |
| 2009-10 | 52.42 | 3.85 | 56.27 | 25.45 | 66.76 | 70.60 |
| 2010-11 | 48.58 | 3.58 | 52.16 | 23.50 | 62.02 | 65.60 |
| 2011-12 | 49.76 | 3.70 | 53.46 | 22.82 | 63.66 | 67.36 |
| 2012-13 | 49.21 | 3.34 | 52.55 | 22.23 | 63.31 | 66.65 |
| 2013-14 | 48.83 | 3.33 | 52.16 | 22.00 | 63.73 | 67.06 |
| 2014-15 | 48.48 | 2.94 | 51.42 | 21.69 | 63.64 | 66.58 |
| 2015-16 | 48.59 | 2.95 | 51.54 | 23.37 | 65.58 | 68.53 |
| 2016-17 | 46.89 | 2.65 | 49.54 | 24.75 | 66.12 | 68.77 |
| 2017-18 | 46.87 | 2.83 | 49.69 | 25.12 | 66.97 | 69.80 |
| 2018-19 | 47.14 | 2.71 | 49.85 | 25.34 | 68.07 | 70.78 |
| 2019-20 | 48.57 | 2.88 | 51.45 | 26.25 | 70.84 | 73.72 |
| 2020-21 | 48.24 | 2.62 | 50.87 | 26.63 | 71.33 | 73.95 |
| Notes :1. Data for 2019-20 are Revised Estimates and data for 2020-21 are Budget Estimates. | ||||||
| 2. External liabilities of the Centre is at current exchange rate. | ||||||
| 3. Total liabilities of the States, Combined domestic liabilities of Centre & States and Combined total liabilities of the Centre & States have been revised to include ‘reserve funds’,‘deposits and advances’ and ‘contingency fund’ of State Governments. | ||||||
| 4. Data in respect of Combined finances are exclusive of NCT Delhi from 2005-06 onwards. | ||||||
| 5. Combined and Centre’s liabilities are inclusive of securities/treasury bills under market stabilisation scheme (MSS). | ||||||
| 6. GDP data for 2020-21 is taken from Union Budget 2020-21. | ||||||
| Also see Notes on Tables. | ||||||
| Sources : 1. Budget documents of the Government of India. | ||||||
| 2. Combined Finance and Revenue Accounts of the Union and the State Governments in India and Budget documents of the State Governments. |
Foreign debt accounts for about 50% of the total debt on Sri Lanka, while for India this figure is relatively low. In the last few years in India, the central and state governments have given relief to the public, but at the same time increased direct or indirect taxes. Whereas in Sri Lanka in the last few years, not only were many taxes abolished, but many types of tax rates were also drastically cut.
Conclusion
According to the investigation conducted by Newschecker, the graphic comparing the debt to GDP ratio of Sri Lanka and India are similar and India will soon face an economic crisis is Misleading.
Result: Misleading/Partly False
If you would like us to fact check a claim, give feedback or lodge a complaint, WhatsApp us at 9999499044 or email us at checkthis@newschecker.in. You can also visit the Contact Us page and fill out the form.
Authors
Vaibhav is a part of Newschecker’s English team, where he spots and debunks all kinds of misinformation, making the rounds on the internet. A Journalism graduate from St. Xavier's College, Mumbai, he holds an M.A degree in Philosophy and an M.Phil from Delhi University.