

Authors
Pankaj Menon is a fact-checker based out of Delhi who enjoys ‘digital sleuthing’ and calling out misinformation. He has completed his MA in International Relations from Madras University and has worked with organisations like NDTV, Times Now and Deccan Chronicle online in the past.
Goa is all set to vote for its 40-member legislative assembly on Monday, in an election that is seen as a three-cornered fight between the BJP, Congress and the AAP, while Mamata Banerjees’s TMC hopes to expand its horizon beyond West Bengal. In the past ten years, the state has seen three chief ministers, Manohar Parrikar (serving two terms), Laxmikant Parsekar and Pramod Sawant. The ruling BJP, hoping for third term has promised free LPG cylinders and no increase in state duties on fuel, not to be outdone by the AAP, which is promising free electricity, water in addition to unemployment benefit of Rs3000, while the Congress banks on anti-incumbency and the ‘nyay scheme’ that promises Rs 6000 for the poor.
But amidst the persuasions and promises, where exactly does the state stand in terms of key indicators? Newschecker analyses where the 10 years of the BJP rule has left Goa.
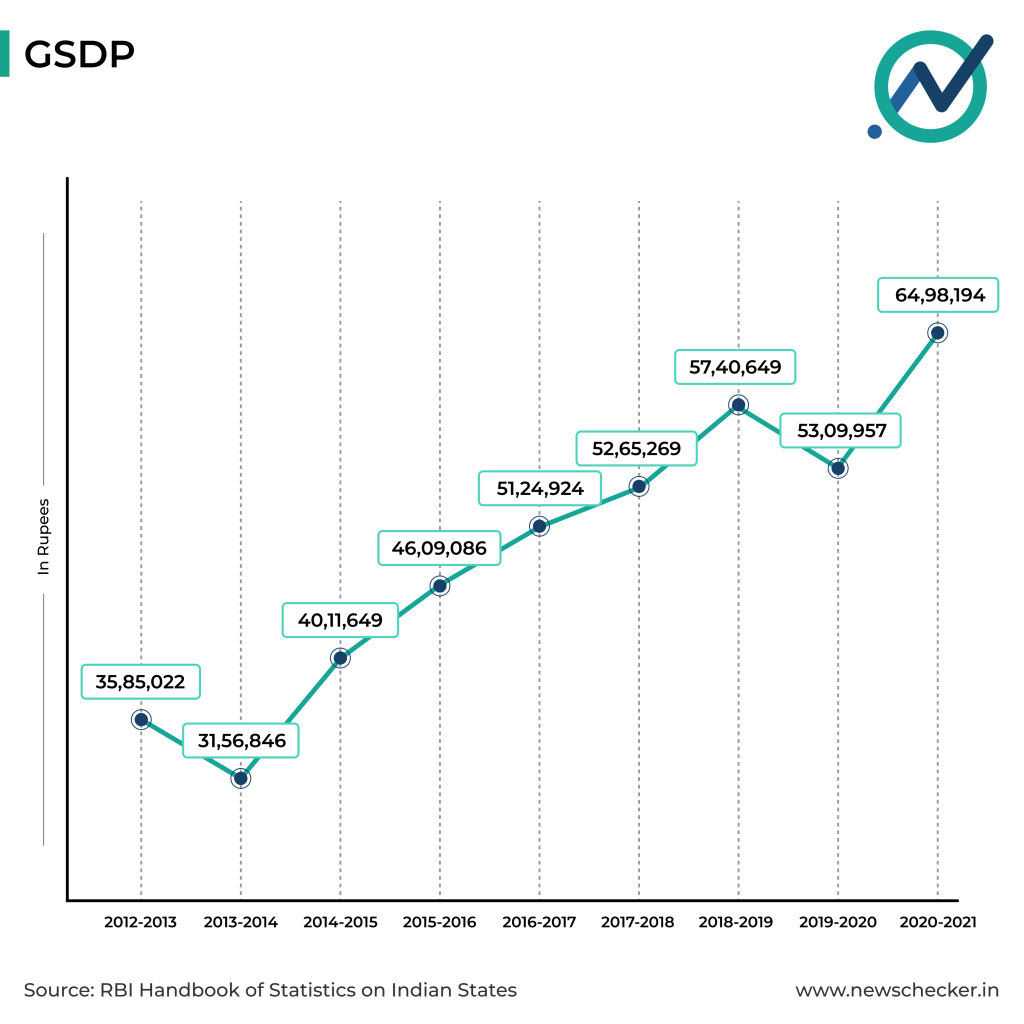
DESPITE PANDEMIC, GOA SEES A RISE IN GSDP & PER CAPITA GSDP
Unlike Uttar Pradesh, which is also heading into polls, Goa’s GSDP (Gross State Domestic Product) has grown by almost 22.4% during the pandemic year of 2020-2021 to Rs 64,98,194, from 53,09,957, the previous year.
But on the whole, BJP’s ten year term in Goa has seen the state GDP climb, albeit a drop at two instances.
According to RBI data, in 2013-14, it fell by 11% in comparison with the previous year, while in 2014-15, it rose by 27%. The rising trend continued till 201-20, when it fell by 7.5%, before rising again.
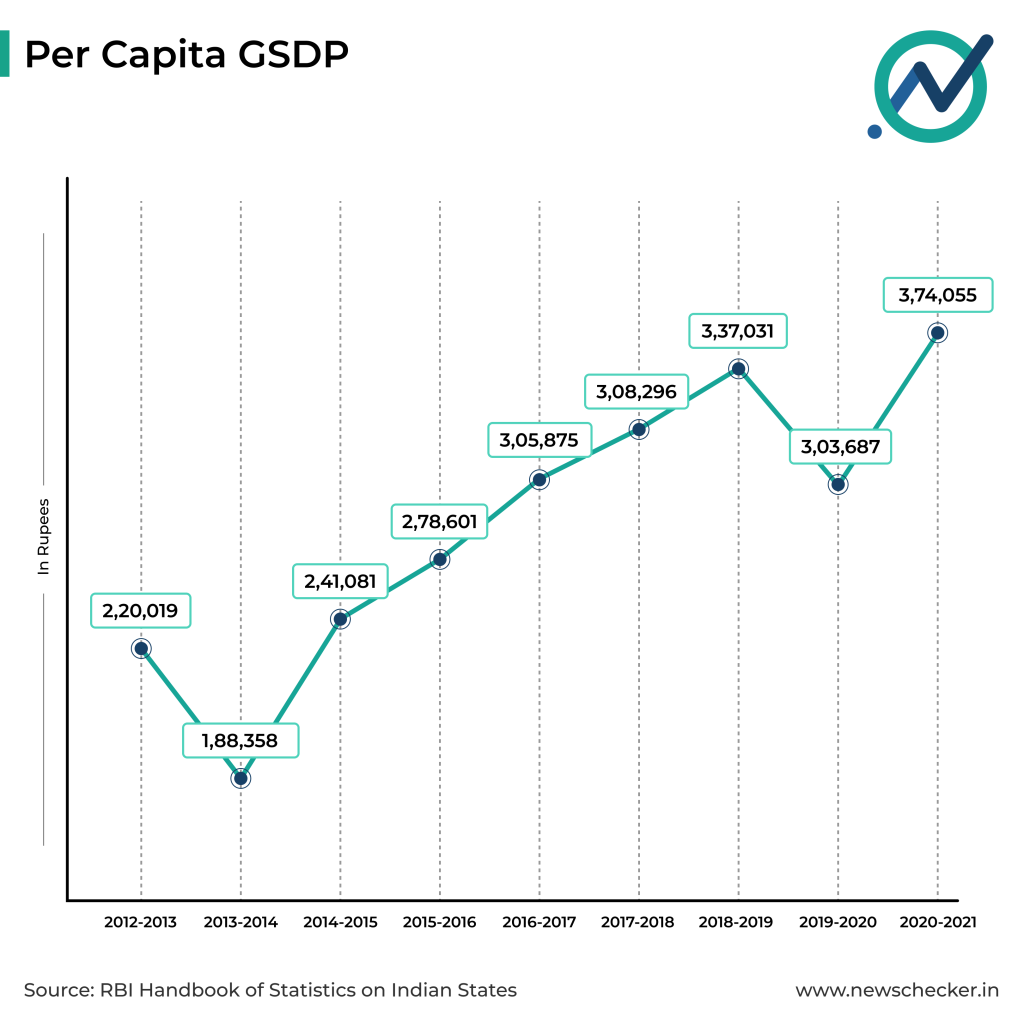
The per capita GSDP of Goa- the highest in the country, registered growth every year, from Rs 2,20,019 in 2012-13 to Rs 3,37,031 in 2018-19. In 2019-20, the Per capita GSDP saw a sharp fall to Rs 3,03,687, before rising again to Rs 3,74,055 in 2020-2021, the highest under the two continuous BJP tenure, despite it being the pandemic year.
GOA: EMPLOYMENT DATA DRAWS A BLEAK PICTURE
An analysis of employment data of Goa compiled by the CMIE from January-April 2016 indicates an interesting trend. While the number of unemployed people in Goa have been brought down over the years, the Unemployment Rate (UER) and the Labour Participation Rate has worsened.
Goa had 2.04 lakh unemployed in January-April 2016 according to the CMIE data. This number has been brought down considerably to 67,000 in September-December 2021.
But the unemployment rate (UER) shows a different trend.
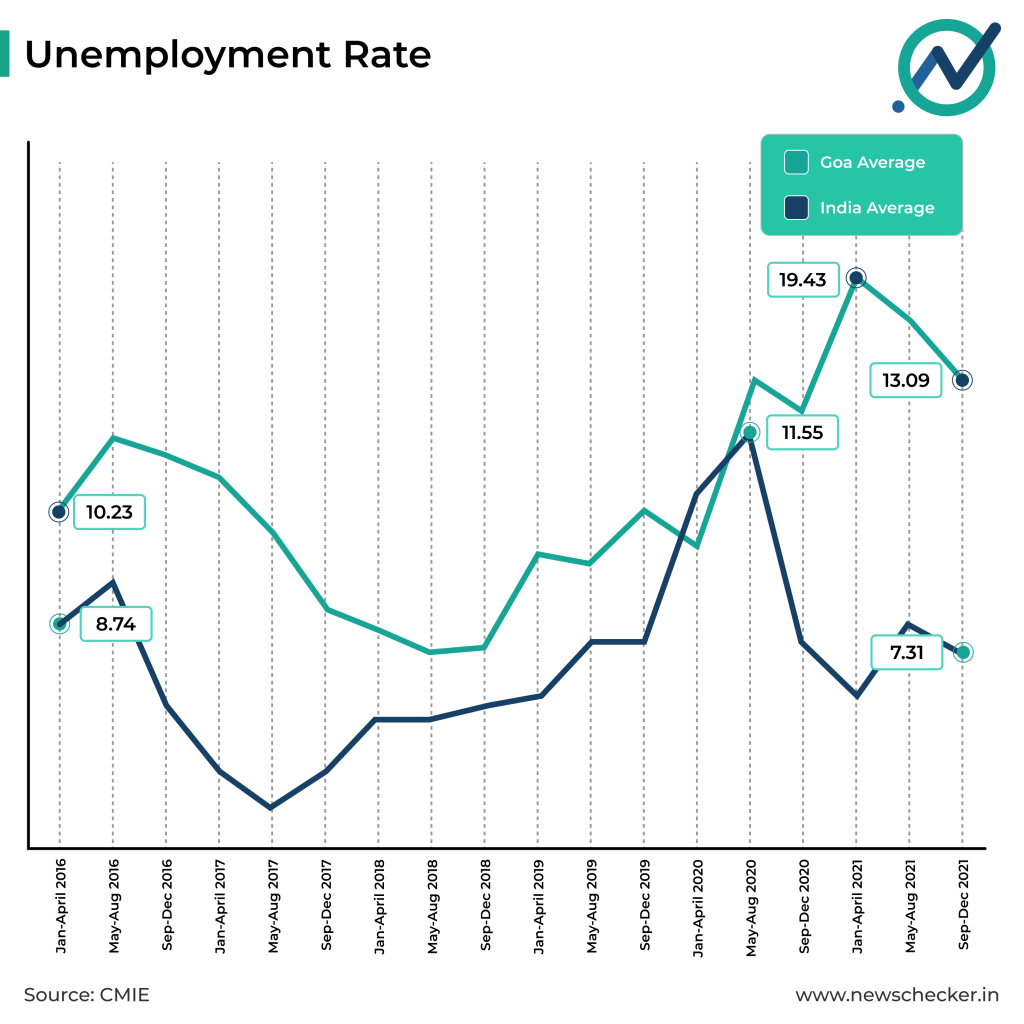
The UER in Goa during January-April 2016 stood at 10.23%. This was more than the national average in the same period, which was 8.74%.
Goa’s UER increased the next quarter (May-August 2016) to 13.46%. From then on, the unemployment rate shows a decreasing trend till it reaches 4.89 in September-December 2018. .
From January-April 2019 through the pandemic, Goa’s UER graph shows ups and downs, till the state records the highest ever UER ever during January-April 2021 at 19.43%. This is more than three times than the national average (6.83%) in the corresponding time.
The latest UER for Goa, as per the CMIE data is 13.09%, while the national average is 7.31%.
The labour participation rate (LPR) is no better.
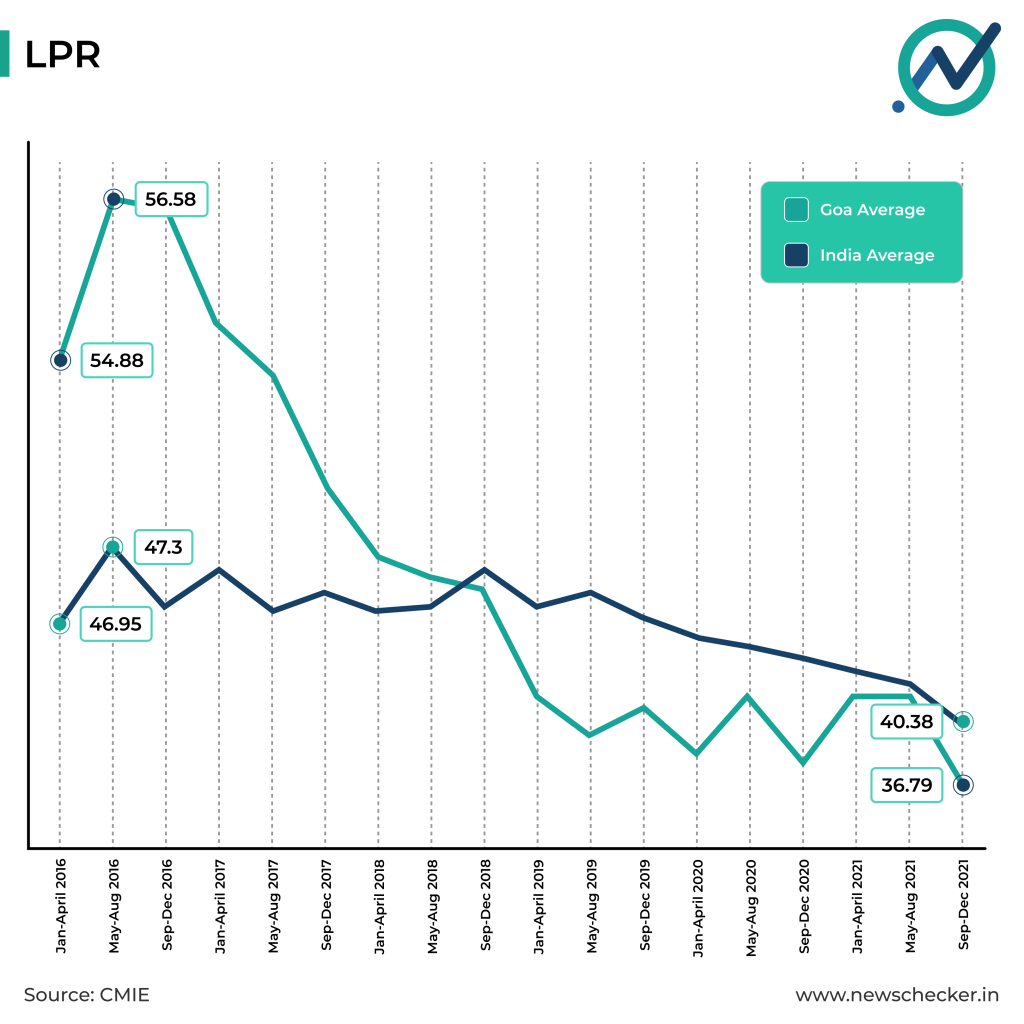
Labour force participation rate is defined as the section of the working population in the age group of 16-64 in the economy currently employed or seeking employment. When there are fewer jobs, people are discouraged to focus on employment which eventually leads to lower participation rate.
The LPR in Goa in January-April 2016 was 54.88%, higher than the national average of 46.95%.
But this figure has seen a consistent drop from Sept-Dec 2016, when it was 56.18%.
In the latest data made available by the CMIE for the September-December 2021 quarter, the LPR of Goa is at an all time low of 36.79%, and is lower than the national average of 40.38%.
Also Read: Uttar Pradesh: How Far Did Yogi Administration Take The State On The Path Of Progress?
CRIME: WOMEN’S SAFETY IMPROVES
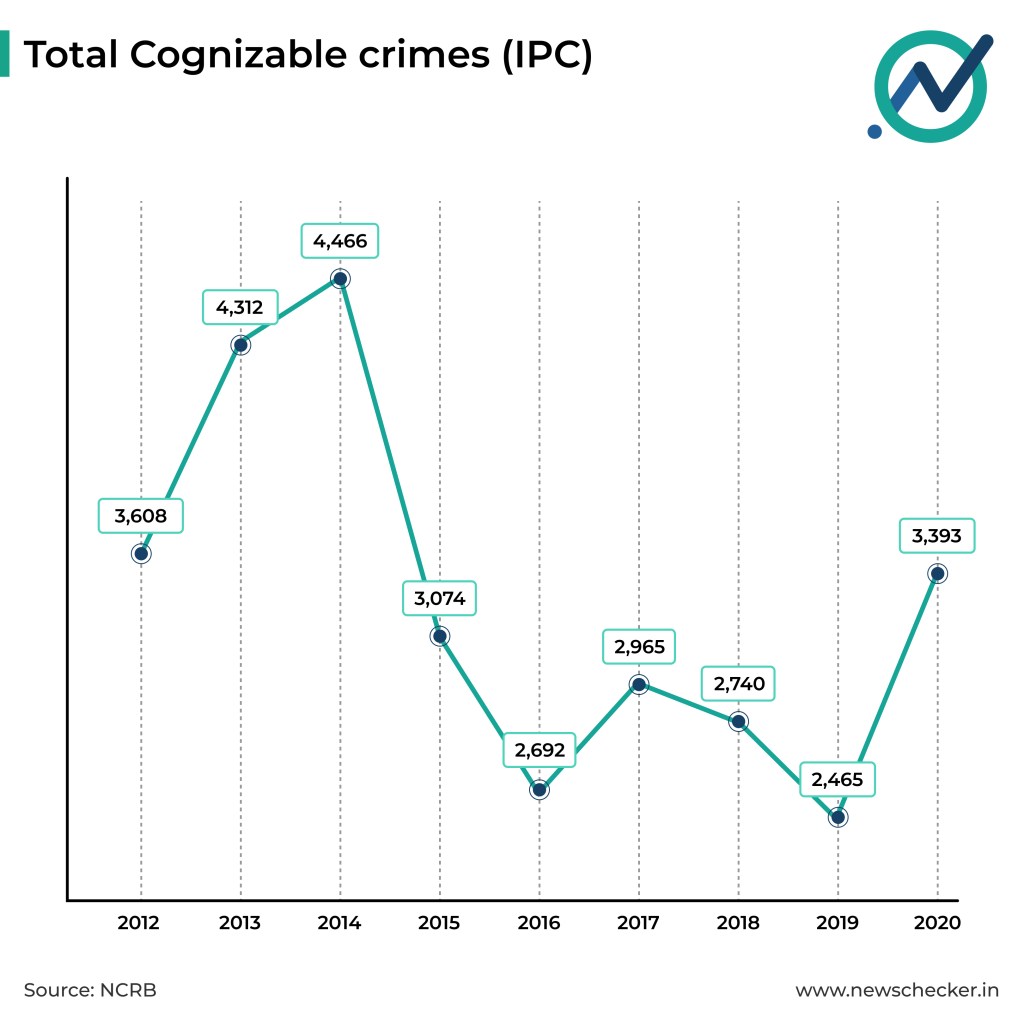
Crime in Goa has seen several peaks and plunges. Goa has had a low crime rate in comparison with larger states like UP. According to the NCRB, the total number of cognizable crimes under IPC increased from 3,608 in 2012 to 4,466 in 2014. The figure then continues to go up and down before rising once again to 3,393 cases in 2020.
Serious crimes such as murder showed slight decrease over the years, but with no drastic changes. While 45 murder cases recorded in 2012, 34 such cases were recorded in the state in 2020.
The number of rapes in Goa increased and then fell over the BJP tenure. The state saw 55 instances of rape in the year 2012, which rose to 95 in 2014, from where it help pacce between 60 & 71 cases per year, till 2020, when it recorded 60 cases.
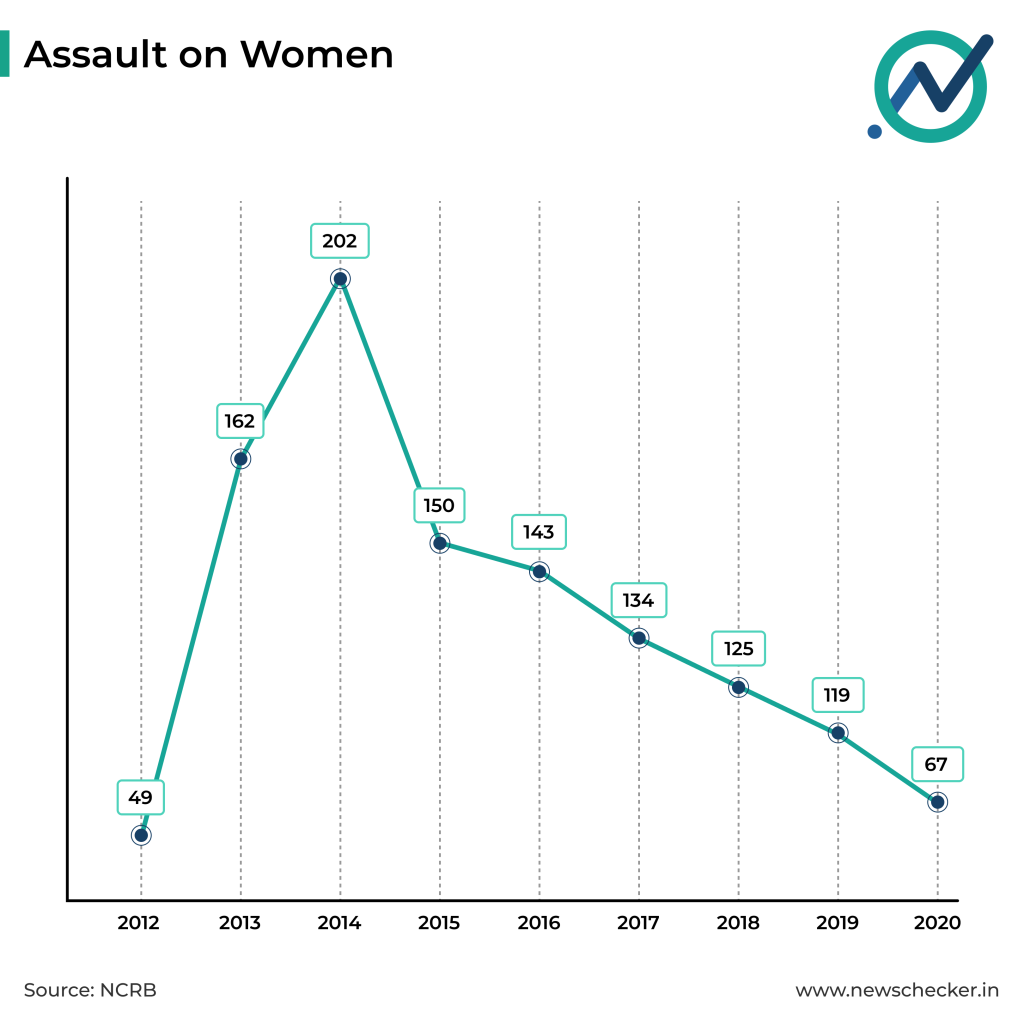
Same trend can be observed in cases of assault on women, which rose from 49 instances in 2012 to 202 in 2014, before gradually decreasing to 67 in the year 2020.
Domestic abuse also rose in the period between 2012(24) and 2013(40), before declining to 8 cases in 2020. The state, meanwhile, has hardly seen dowry deaths, with a total of 4 such recorded instances in years according to NCRB data.
When it comes to law enforcement infrastructure, Goa has a higher police per population ratio (PPR- the number of police personnel per 1 lakh of the population) in comparison with some of the more populous states. But on reading the sanctioned and actual figures together, we observe that it falls short.
Goa had a sanctioned PPR of 343.65 in 2017, while the actual PPR was 291.71. This figure rose to sanctioned PPR of 659.16 in 2020 and while the actual PPR was only 511.78.
The same trend has been observed with the population per police person (PPP). The population per police of Goa in 2012 was 343, meaning that there was 1 policeman for 343 people in Goa. Whereas the sanctioned figure is 291 people per police person.
In 2020, while this figure improves. But even though the sanctioned PPP of the state was 151.71, the actual figures were 195.4.
HEALTH SPENDING IMPROVES, BUT HEALTH INDICATORS SHOW MIXED TREND
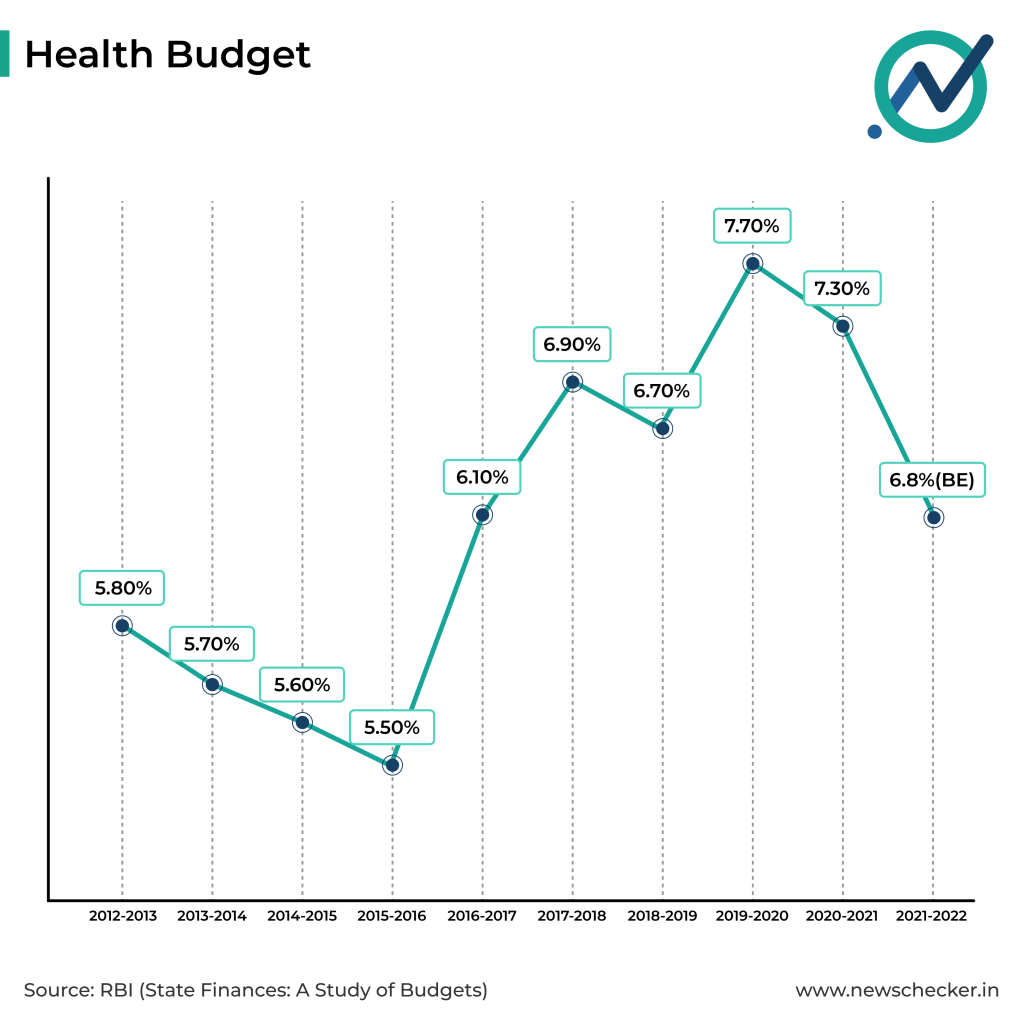
Goa’s expenditure on health has not seen a steady trend. It drops in the first 4 years of the government before it sees several spikes and falls.
According to the RBI, Goa spent 5.8% of its total expenditure on health during the year 2012-2013. This drops slightly to 5.7% in 2013-2014 and 5.6% in 2014-2015. It touched 5.5%, the lowest under the BJP government in 2016-2016, before picking up from 2016-2017 at 6.1%.
Goa spent 6.9 percent of its total expenditure on health in 2017, before it falls again to 6.7% in 2018-19. It once again swings upwards to 7.7% in 2019-2020, the highest expenditure by BJP government on health.
It begins to drop once again to 7.3% in 2020-2021 and 6.8% in 2021-2022 (Budget estimates).
In terms of health infrastructure, National Health Profile data shows the number of PHCs (Primary Health Centre) grew from 19 in 2012 to 59 by 2021. The number of hospital beds also increased, although marginally, from 2,510 to 3,086. Figures on the shortfall of specialists at government hospitals remain in the same range, with a shortfall of 12 doctors in 2015 to 10 in 2020.
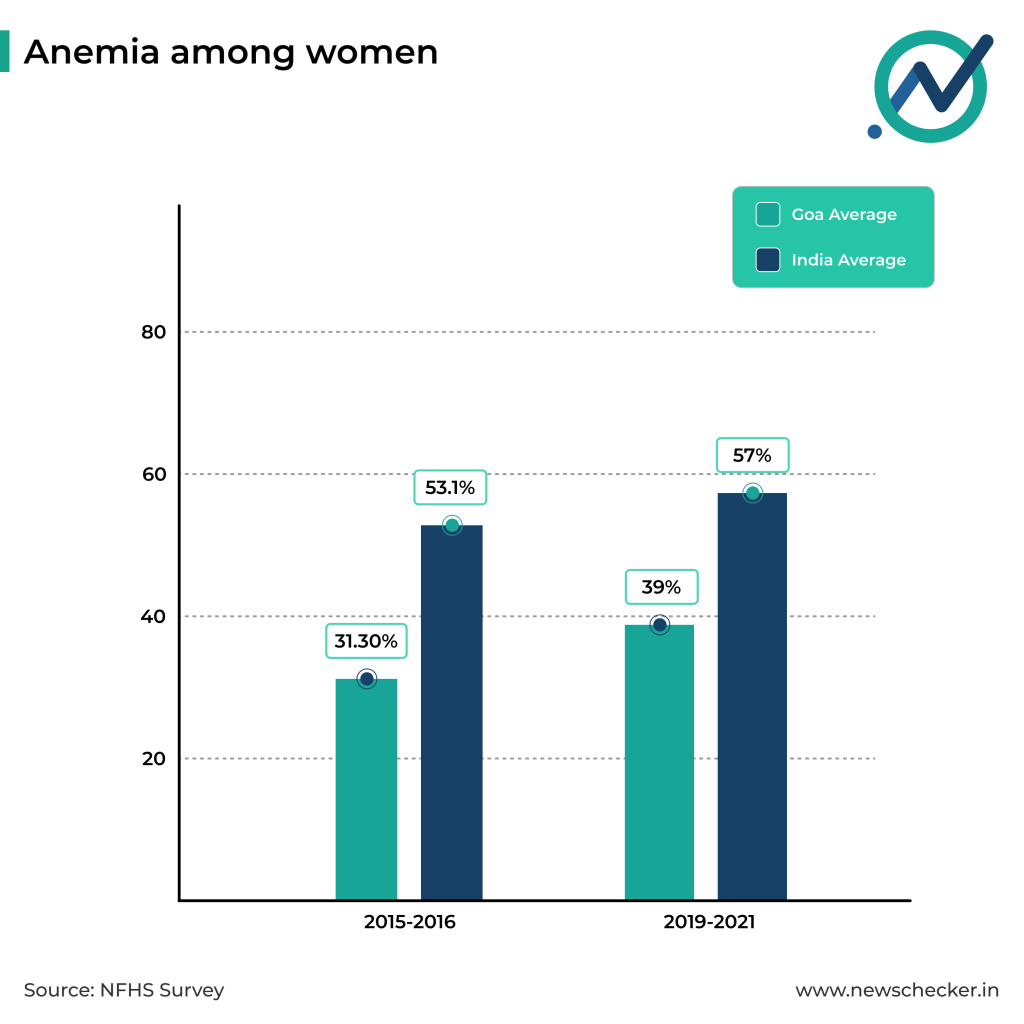
Looking at the health indicators, anaemia among women worsened in the state, with the NFHS reporting a rise from 31.3% in 2015-16 to 39% in 2019-21. This coincides with the national trend of increasing cases of anaemia among women, but is still lesser than the India average in both years.
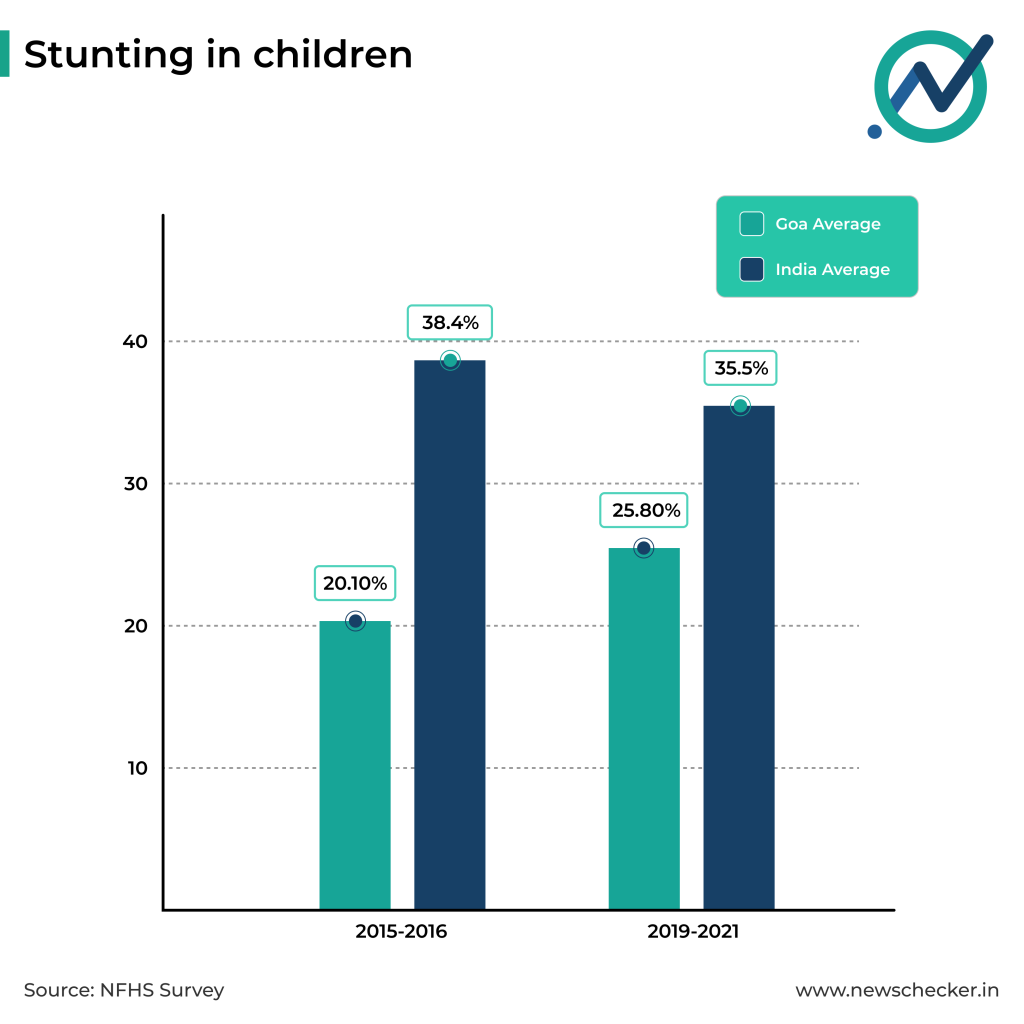
Stunting in children also saw a spike, going up from 20.10% in 2015-16 to 25.80% in 2019-21, and just as in anaemia among women, was much lesser than the national average.
But infant mortality rate (IMR) and severe wastage in children showed a declining trend. While Goa’s IMR was 12.9% in 2015-16, it fell to 5.6% in 2019-21. This is much less than the national average and coincides with the national trend of decreasing IMR.
Severe wastage also showed a drop. Goa’s figures for severe wastage among kids in 2015-16 was 9.50%. This was more than the national average (7.5%) in the same period. In 2019-21, as Goa’s statistics on severe wastage fell to 7.5%, the all India average rose to 7.7%.
If you would like us to fact check a claim, give feedback or lodge a complaint, WhatsApp us at 9999499044 or email us at checkthis@newschecker.in. You can also visit the Contact Us page and fill out the form.
Authors
Pankaj Menon is a fact-checker based out of Delhi who enjoys ‘digital sleuthing’ and calling out misinformation. He has completed his MA in International Relations from Madras University and has worked with organisations like NDTV, Times Now and Deccan Chronicle online in the past.